How to Calculate mean in SPSS? This is the problem of every beginners. In this tutorial, I am going to tell you how to calculate mean for a variable of interest from a set of variables of data.
Table of Contents
Step 1: Import the Data
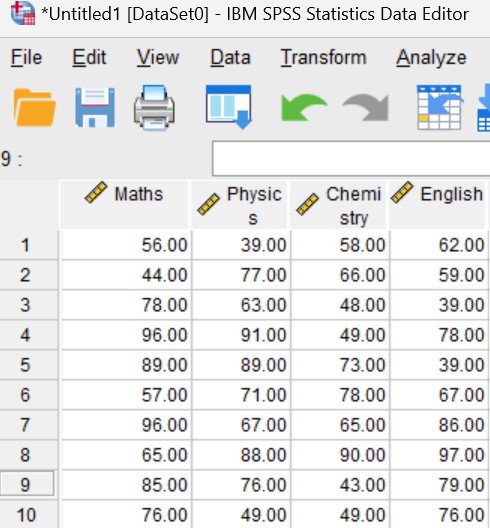
Import the interested data ,you want to work on.

As you can see we got four variables (a) Math – which is the scores of 10 students in subject mathematics, (b) Physics- scores of 10 students in subject physics, (c) Chemistry and (d) English in subject Chemistry and English.
You want to find out the means of the given data of four subjects.
Step 2: Calculation
Click on Analyze ->Descriptive Statistics ->Descriptives
To Calculate the mean Click on Analyze ,choose Descriptive Statistics, choose Descriptives as shown below:

Choose the Variable for which you want to calculate Mean
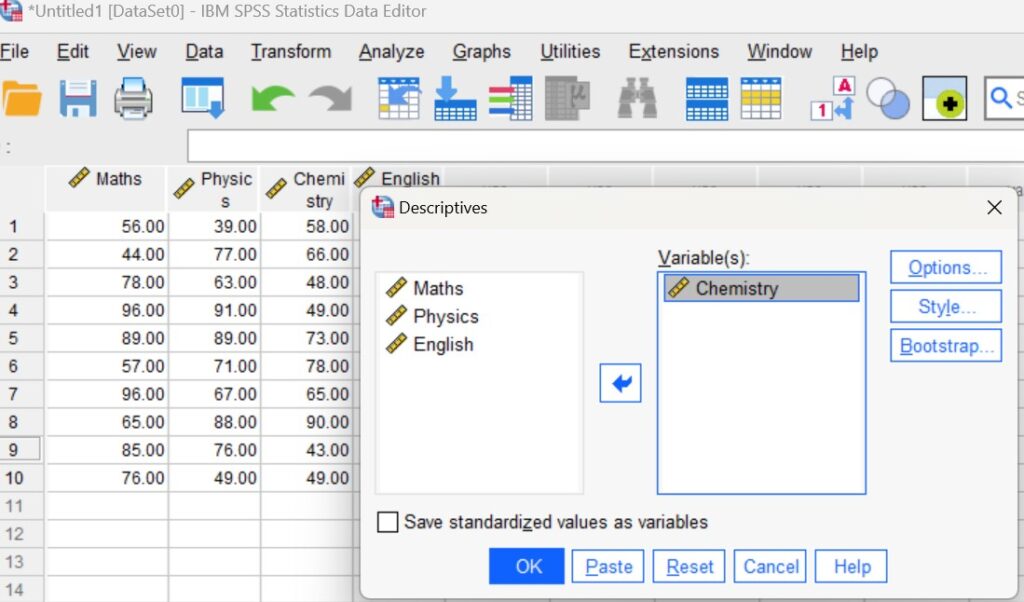
After you click on Descriptives, a dialog box open such as given below

You need to put the variable of interest into the box Variables(s) (as shown above).This can be done by selecting it on the left, and then clicking the blue arrow button.
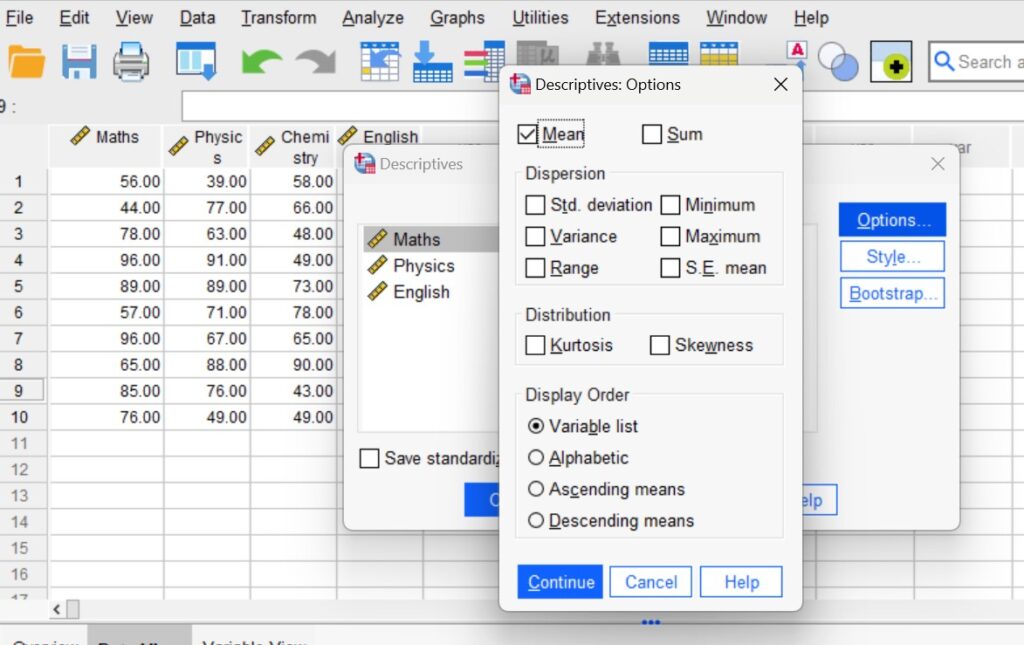
Click on Options
Now , Click on options and select mean.

Press Continue, and then press OK in the Descriptives dialog box.
Step 3: Final Result
Finally , you get the result of your interest as shown below

What is mean in SPSS ?
The mean is basically an average for given data.
How to interpret mean in SPSS
Some general guidelines for interpreting the mean are:
1. If your mean is close to the median and mode, the distribution of the variable is similar to be symmetric and normal.
If the mean is much higher or lower than the median and the mode, the distribution of the variable is likely to be skewed and non-normal. This means that there are some values that are very different from the rest and affect the mean. In this case, the median might be a better measure of central tendency than the mean.
2. If the standard deviation is small, the mean is more representative of the variable, as the values are more consistent and similar to each other. If the standard deviation is large, the mean is less representative of the variable, as the values are more dispersed and varied.
3. If the range is small, the mean is more reliable, as the values are more concentrated and have less variation. If the range is large, the mean is less reliable, as the values are more spread out and have more variation.
4. To interpret the mean in SPSS, you can use the Descriptive Statistics or Compare Means commands from the Analyze menu. These commands will produce tables that show the mean and other statistics for your variable or variables.